Integrating Chart.js into Laravel 11

by WebWays

664

Posted 22.04.2024

Laravel Chart.js

In modern web development, data visualization is crucial for presenting information effectively. Laravel, as a powerful PHP framework, provides an excellent foundation for building interactive applications. When it comes to integrating dynamic charts and graphs, Chart.js emerges as a popular choice due to its simplicity and flexibility. In this blog post, we will explore how to seamlessly integrate Chart.js into a Laravel 11 project to create compelling data visualizations.

Prerequisites

Before getting started, you ensure you have the following set up on your development environment:

  1. Composer installed globally
  2. Laravel 11 installed on your machine
  3. Basic understanding of Laravel's directory structure and MVC architecture

Step 1: Set Up a New Laravel Project

If you haven't already created a Laravel project, start by using Composer to set up a new project:

composer create-project --prefer-dist laravel/laravel chart-app

Navigate into your project directory:

cd chart-app

Step 2: Install Chart.js via CDN

Next, install the Chart.js including the following CDN link  in the section:

<script src="https://cdn.jsdelivr.net/npm/chart.js"></script>

Step 3: Create a Controller

Generate a new controller using the Artisan command line tool:

php artisan make:controller ChartController

This command will create a new file ChartController.php in the app/Http/Controllers directory.

Step 4: Define Routes

Open the web.php file located in routes directory (routes/web.php) and define a route to handle chart requests:

use App\Http\Controllers\ChartController;

Route::get('/chart', [ChartController::class, 'index']);

Step 5: Implement Chart.js in Blade View

Create a new Blade view file where you will render the chart:

touch resources/views/chart.blade.php

Open chart.blade.php and add the HTML structure to render the chart using Chart.js:

<!DOCTYPE html>
<html lang="{{ str_replace('_', '-', app()->getLocale()) }}">
<head>
    <meta charset="utf-8">
    <meta name="viewport" content="width=device-width, initial-scale=1">

    <title>Laravel</title>

    <!-- Fonts -->
    <link rel="preconnect" href="https://fonts.bunny.net">
    <link href="https://fonts.bunny.net/css?family=figtree:400,600&display=swap" rel="stylesheet" />
    <script src="https://cdn.jsdelivr.net/npm/chart.js"></script>
</head>
<body>
    <div class="container">
        <canvas id="myChart"></canvas>
    </div>
    <script>
        var ctx = document.getElementById('myChart').getContext('2d');
        var myChart = new Chart(ctx, {
            type: 'bar',
            data: {
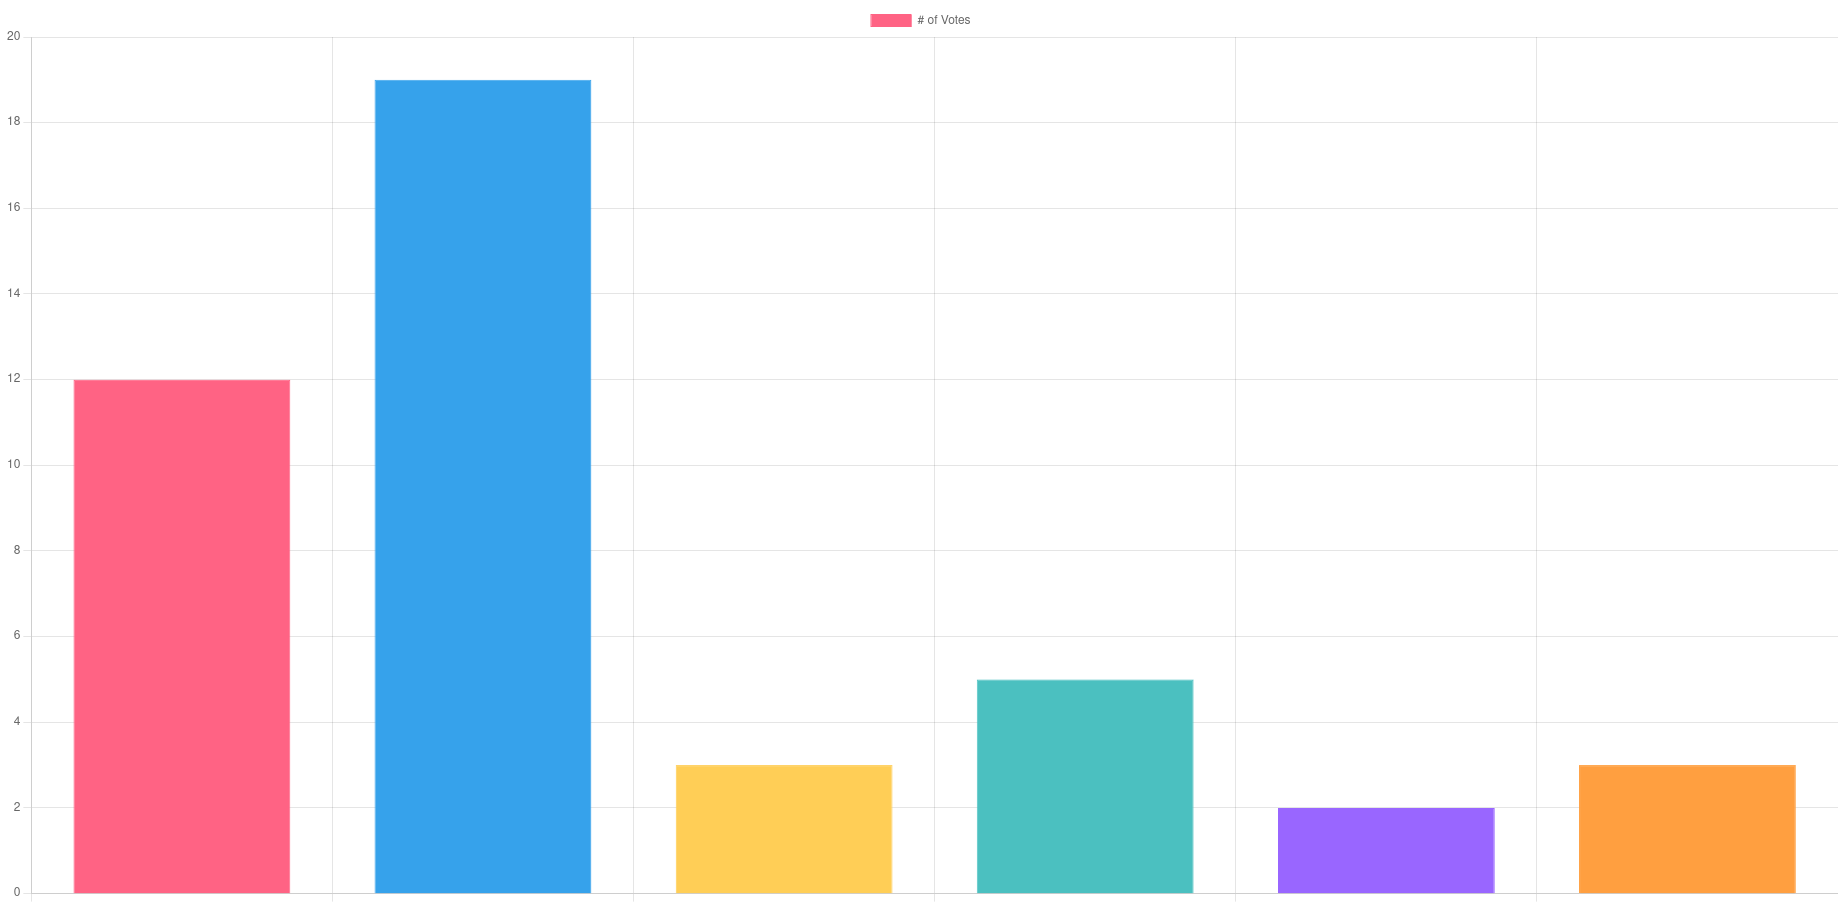
                labels: ['Red', 'Blue', 'Yellow', 'Green', 'Purple', 'Orange'],
                datasets: [{
                    label: '# of Votes',
                    data: [12, 19, 3, 5, 2, 3],
                    backgroundColor: [
                        'rgba(255, 99, 132, 1)',
                        'rgba(54, 162, 235, 1)',
                        'rgba(255, 206, 86, 1)',
                       'rgba(75, 192, 192, 1)',
                       'rgba(153, 102, 255, 1)',
                       'rgba(255, 159, 64, 1)'
                    ],
                    borderColor: [
                        'rgba(255, 99, 132, 1)',
                        'rgba(54, 162, 235, 1)',
                        'rgba(255, 206, 86, 1)',
                        'rgba(75, 192, 192, 1)',
                        'rgba(153, 102, 255, 1)',
                        'rgba(255, 159, 64, 1)'
                    ],
                    borderWidth: 1
                }]
            },
            options: {
                scales: {
                    y: {
                        beginAtZero: true
                    }
                }
            }
        });
    </script>
</body>>
</html>

Step 6: Define Controller Logic

Open ChartController.php and add the logic to load the view:

<?php

namespace App\Http\Controllers;

use Illuminate\Http\Request;

class ChartController extends Controller
{
    public function index()
    {
        return view('chart');
    }
}

Step 7: Compile Assets

Compile the assets (including Chart.js) using Laravel Mix:

npm run dev

Step 8: Access the Chart

Start the Laravel development server:

php artisan serve

Navigate to http://localhost:8000/chart in your web browser to see the rendered chart using Chart.js within your Laravel 11 application.

Conclusion

In this tutorial, we've demonstrated how to integrate Chart.js, a popular JavaScript charting library, into a Laravel 11 project. By following these steps, you can create dynamic and interactive data visualizations to enhance the user experience of your Laravel applications. Experiment with different chart types, data sources, and configurations to tailor the charts to your specific requirements.

Share on social media

Comments

Leave your comment


*By submitting this form, I confirm that I have read GDPR Policies and give consent to contact me.

MOST VIEWED POSTS

Integrating Chart.js into Laravel 11
How to reset WordPress Admin Password on Localhost
How to Integrate Vue.js with Laravel: A Step-by-Step Guide
Install Wordpress on Ubuntu Server
How to add Validation Rules in Laravel
How to Schedule Posts in Laravel

RANDOM POSTS

How to reset WordPress Admin Password on Localhost
Install Wordpress on Ubuntu Server
How to Integrate Vue.js with Laravel: A Step-by-Step Guide
Integrating Chart.js into Laravel 11
Building Laravel UI with Blade Components
How to Schedule Posts in Laravel